Plotter
The plotter, Plotter, is an opinionated and customized plotter based on matplotlib suitable for the
plotting of signals and their generated artifacts in python-signal-edges. It supports additional features such as the use
of rasters when plotting millions of samples, shared horizontal axis between plots or plot of cursors for points
of interest.
The plotter is used throughout the package to generate the plots included in this documentation, some other more complex plots that can be achieved with this plotter are shown below:
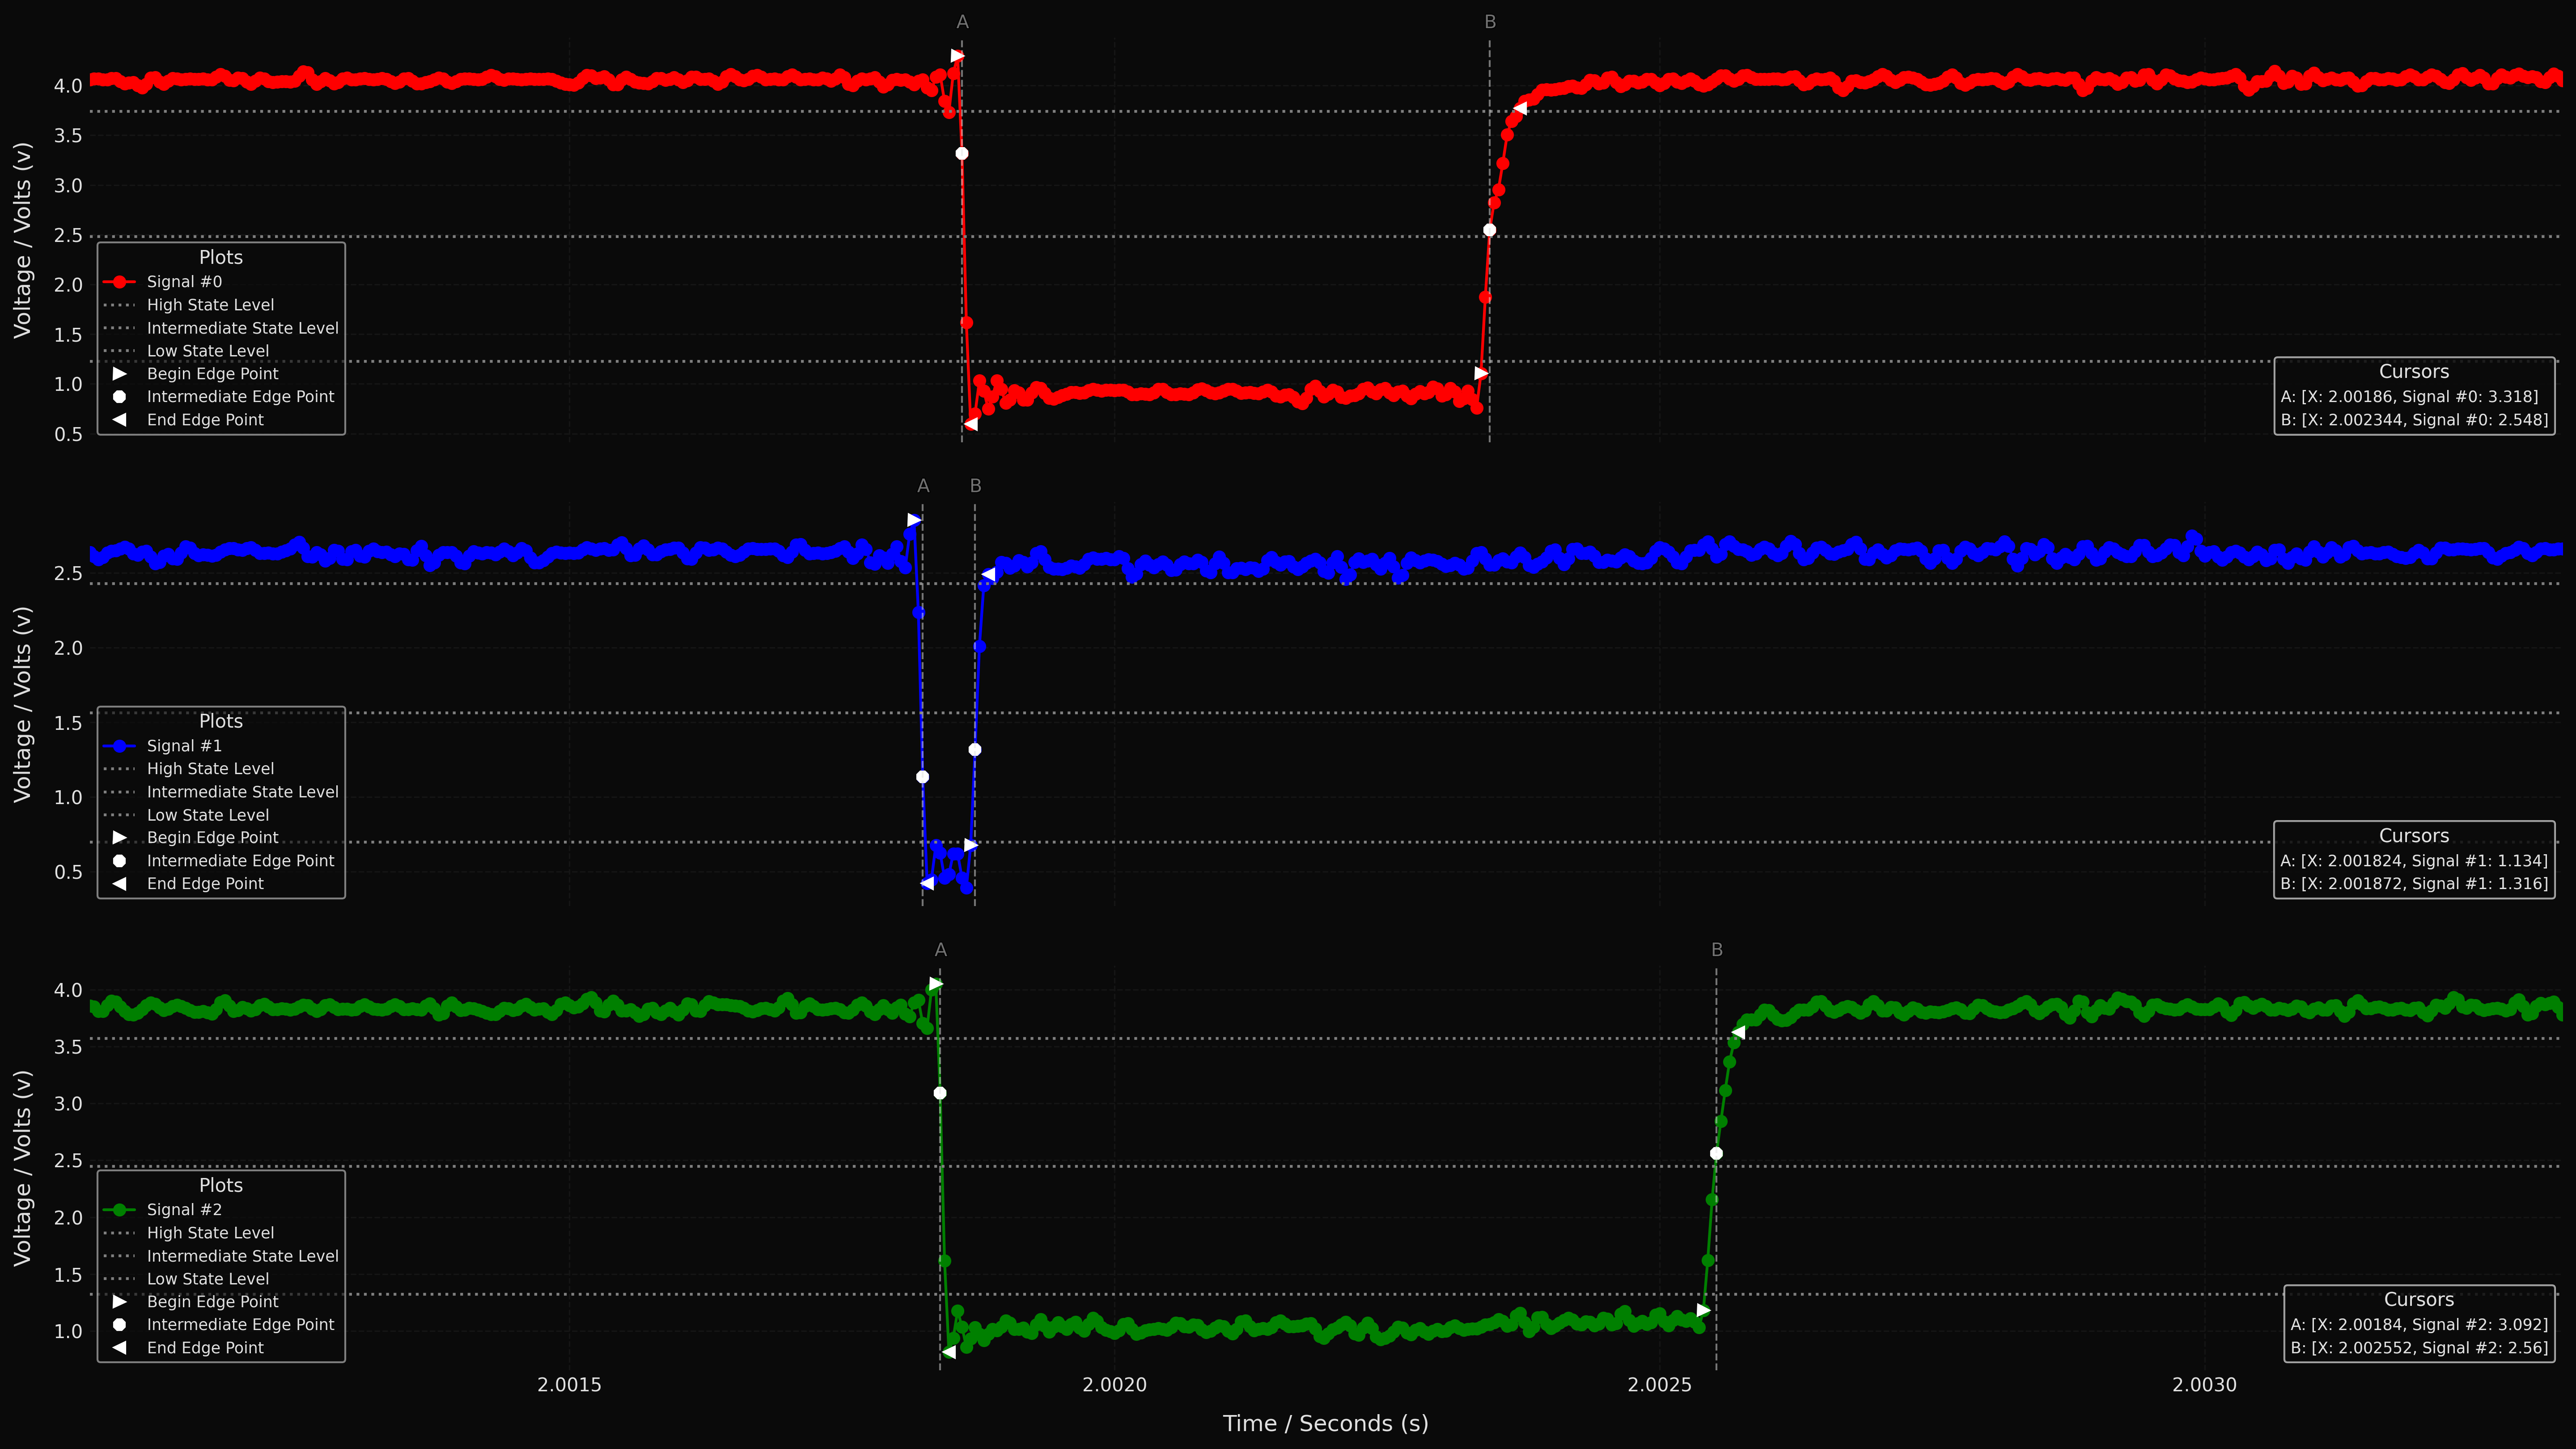
Plot of three different signals with synchronized edges, with cursors, state levels and points of the edges.
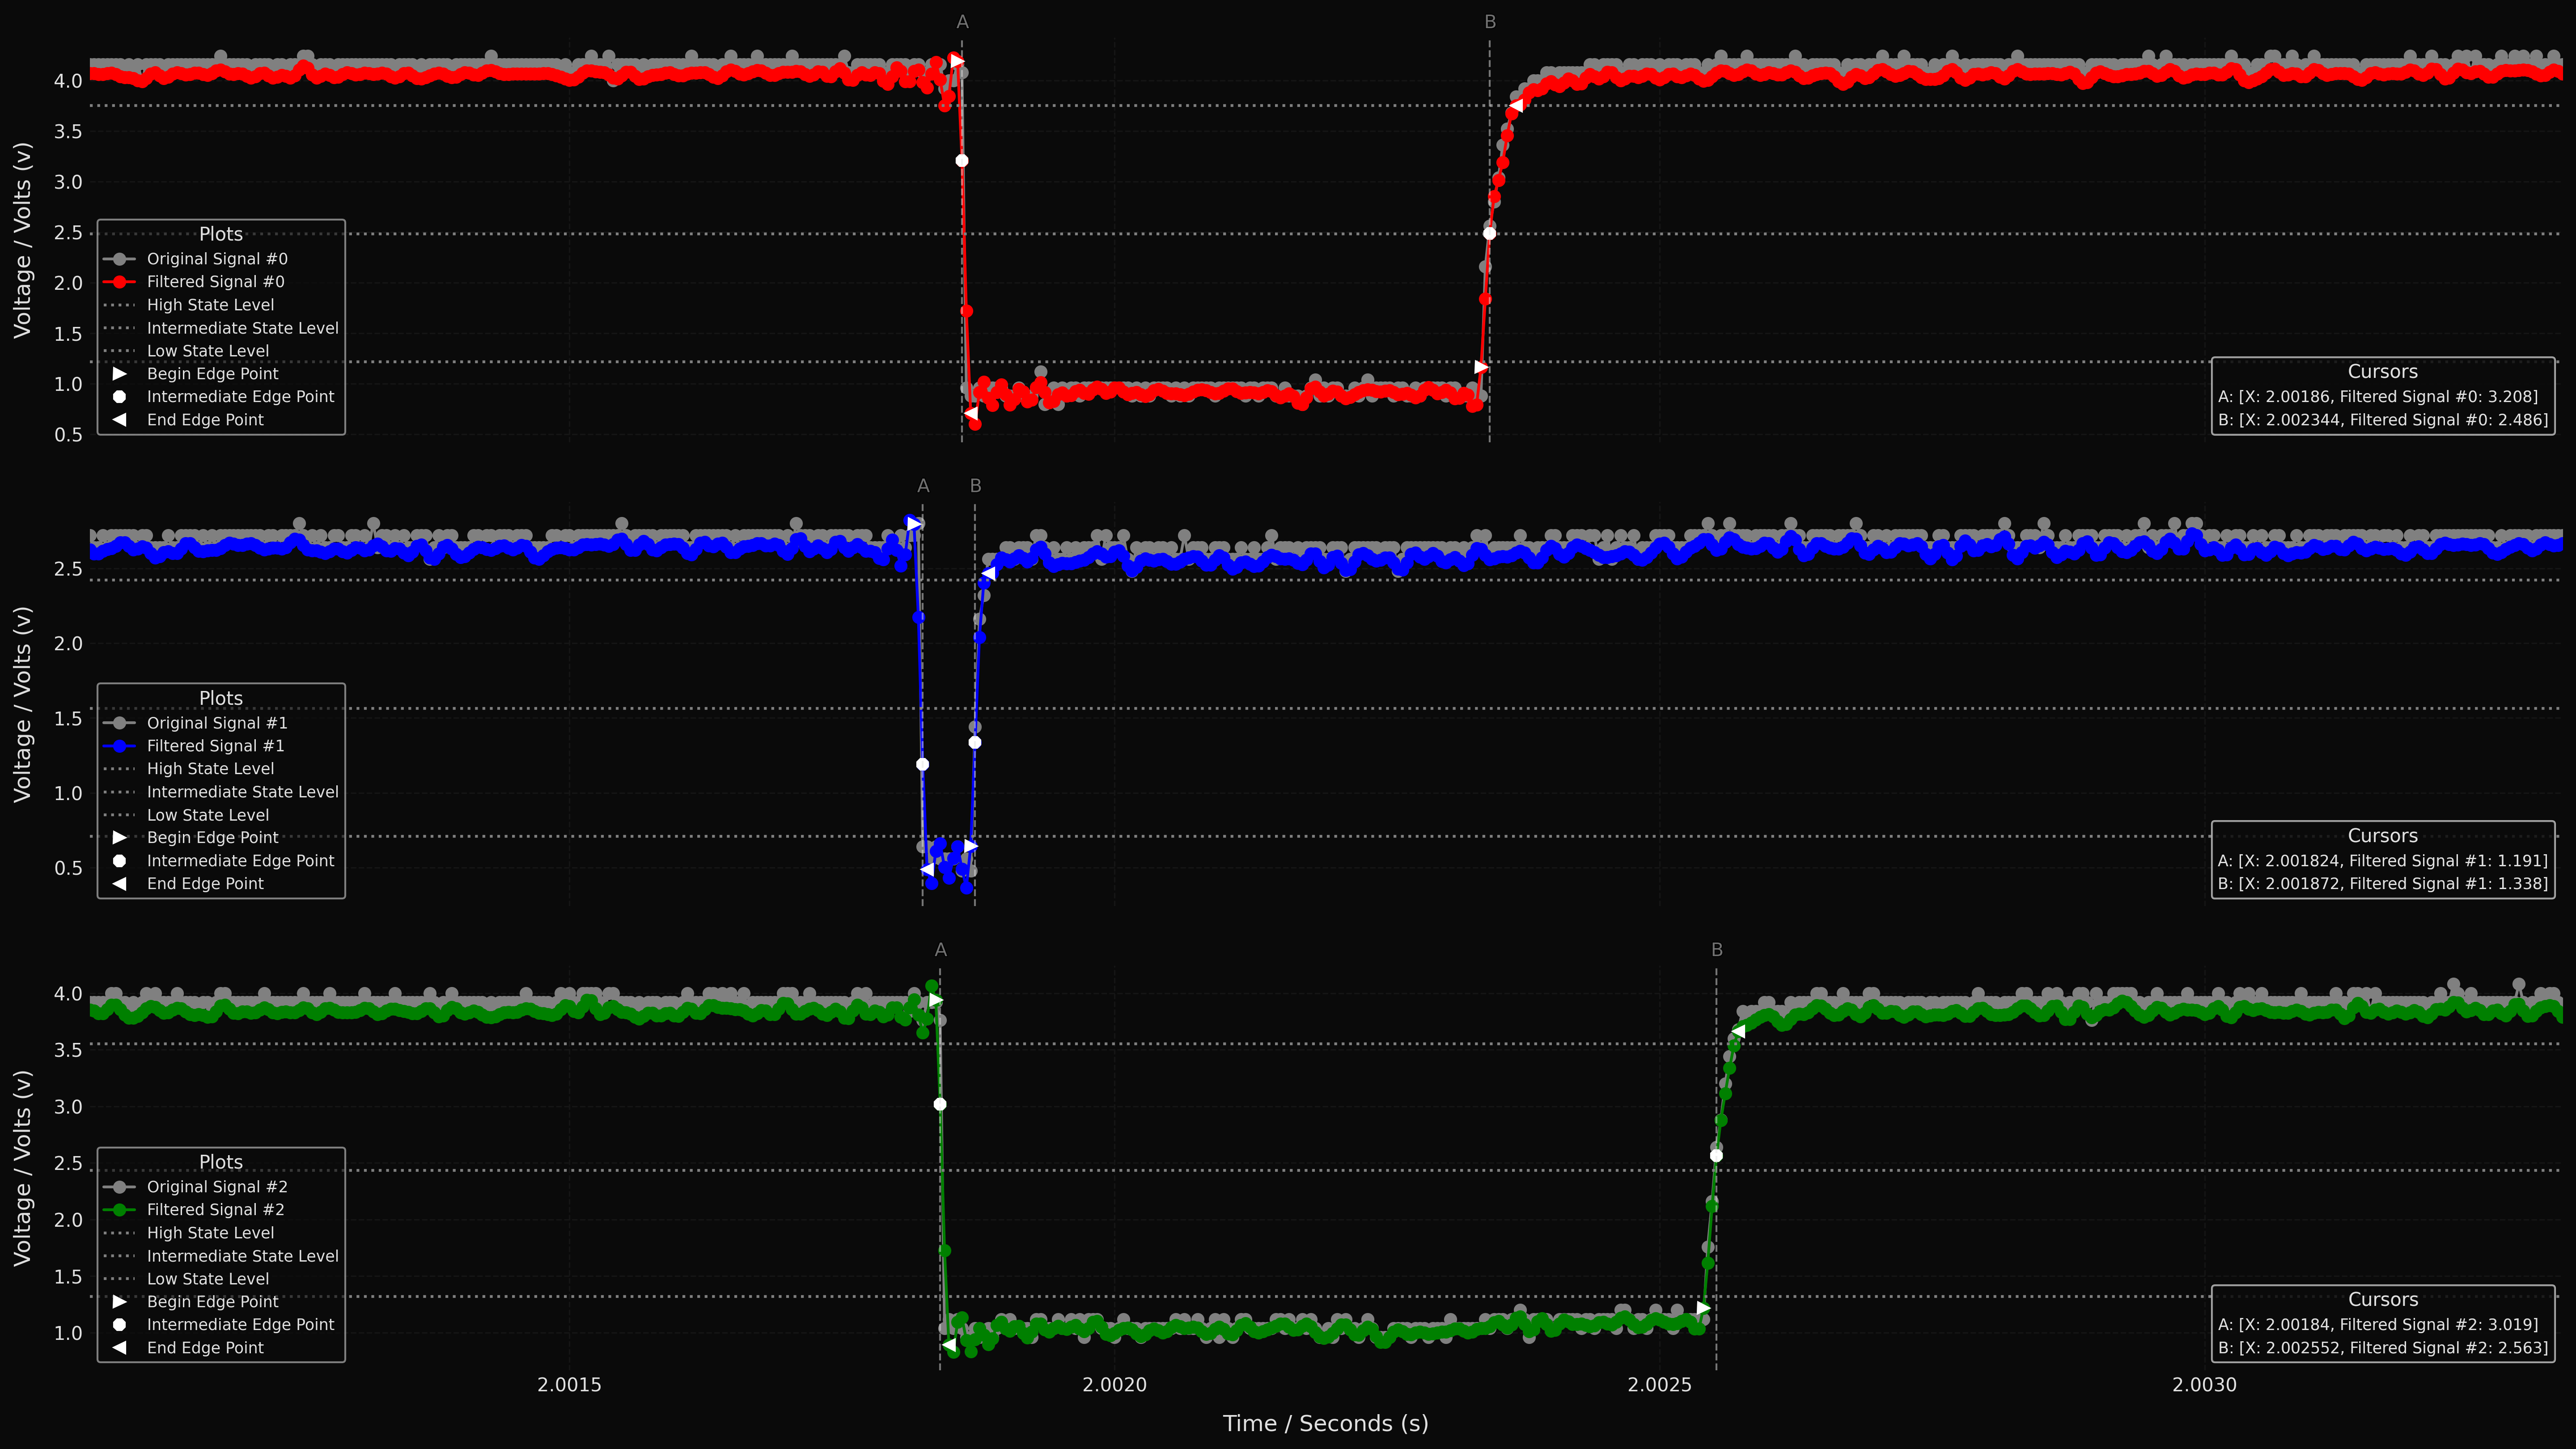
The same plot as before but with the original unfiltered signals in grey.
The plotter supports many different kinds of plots to explicitly document them all, for code snippets and examples, refer to the existing uses of the plotter throughout python-signal-edges and the API described below.
- class Plotter
Implementation of an plotter based on matplotlib.
- __init__(*args, mode=Mode.LINEAR, rows=1, columns=1, **kwargs)
Class constructor.
- Parameters:
- Raises:
PlotterError – The number of rows must be higher than zero.
PlotterError – The number of columns must be higher than zero.
PlotterError – The number of columns for an horizontal shared axis plot must be one.
- add_plot(row, column, subplot)
Adds a subplot to the plot at specified row and column indices.
- Parameters:
- Raises:
PlotterError – The begin and end value of the subplot to add are inconsistent.
PlotterError – The values provided for one of the axis are empty, not the same length or invalid.
PlotterError – The row and column indices given do not map to a plot.
PlotterError – The subplot identifier provided already exists in the plot.
PlotterError – The units of the horizontal and vertical axes of the subplot must match current plot.
PlotterError – When sharing an horizontal axis, all horizontal axis and margin units must be the same.
- Return type:
- Returns:
Instance of the class.
- add_cursor(cursor)
Adds a cursor to the plot.
- Parameters:
cursor (
Cursor) – The definition of the cursor to add.- Raises:
PlotterError – The row and column indices given do not map to a plot.
PlotterError – No subplot identifiers were given for cursor.
PlotterError – At least one of the subplot identifiers in the cursor is invalid.
PlotterError – The index of the cursor does not exist in all the subplots specified.
- Return type:
- Returns:
Instance of the class.
- plot(path, dpi=300.0, figsize=(19.2, 10.8), raster_limit=1920, backend='Agg')
Runs the plotter and saves the results to file.
- Parameters:
path (
str) – Path where to store the resulting.pngfile with the plot.dpi (
float) – Seematplotlib.figure.Figurefor details.figsize (
tuple[float,float]) – Seematplotlib.figure.Figurefor details, defaults to 1080p.raster_limit (
int) – Uses rasters and pixel markers below this number of values to optimize plotting speed.backend (
str) – Seematplotlib.figure.Figure.savefig()for details.
- Return type:
- Returns:
Instance of the class.
- class Mode
Plotter mode provides some customization options between plots.
- LINEAR = 1
Linear plotter with independent vertical axis and horizontal axis in each plot.
- SHARED_H_AXIS = 2
Linear plotter with shared horizontal axis for all subplots, a single column is required.
- class Units
Units provide a name, a symbol and magnitude for display.
- class Subplot
Definition of a subplot within a plot.
- Parameters:
name (
str) – Name of the subplot, must be unique within the plot.hvalues (
ndarray[Any,dtype[float64]]) – 1xN array with values for the horizontal axis, they must satisfy the requirement x[n] < x[n+1].hunits (
Units) – The units for the horizontal axis.vvalues (
ndarray[Any,dtype[float64]]) – 1xN array with the values for the vertical axis.vunits (
Units) – The units for the vertical axis.begin (
float) – The value on the horizontal axis where the plotting starts.end (
float) – The value on the vertical axis where the plotting ends.munits (
float) – The margin units to both sides of the plot, a margin unit equalsbegin-end.color (
str) – A matplotlib RGB/RGBA string or named color, such as#FFFFFF80orblack.linestyle (
str) – A matplotlib named linestyle value, such assolidordashed.marker (
str) – A matplotlib named marker value, such asnoneoro.
- class Cursor
A vertical line that marks values of interest in one or more subplots within a plot.
- Parameters:
name (
str) – Name of the cursor for display, it is recommended to use a single character.hindex (
int) – The index of the horizontal value of the first subplot in the plot for the cursor.row (
int) – The row index of the plot.column (
int) – The column index of the plot.subplot_ids (
Sequence[str]) – Identifiers of the subplots for which the cursor should fetch vertical axis values.hvdec (
int) – Number of decimals for the value on the horizontal axis on display.vvdec (
int) – Number of decimals for values on the vertical axis of relevant subplots on display.color (
str) – A matplotlib RGB/RGBA string or named color, such as#FFFFFF80orblack.linestyle (
str) – A matplotlib named linestyle value, such assolidordashed.
- exception PlotterError
Opinionated plotter exception class.