Signal
The signal class, Signal, is the base class from which specialized signals can be created and to which
mixins with additional functionality can be added, the current available mixins are the following:
Filter mixins,
BesselFiltersMixin,ButterworthFiltersMixin,EllipticFiltersMixin, to filter the signal by different methods also providing the possibility to implement your own filters via theFiltersMixinbase class.State levels mixin,
StateLevelsMixin, to calculate the logical state levels of the signal.Edges mixin,
EdgesMixin, to obtain the edges of the signal.
A detailed example of an specialized signal that ships with the package is the voltage signal, VoltageSignal,
its implementation can be checked for details on how to use the base signal class.
An example of its usage is shown in the following code snippet:
import numpy as np
import signal_edges.signal as ses

# Create timestamps in seconds for the signal, the horizontal axis.
signal_timestamps = np.linspace(start=0, stop=160, num=160, endpoint=False)
# Create voltages in seconds for the signal, the vertical axis.
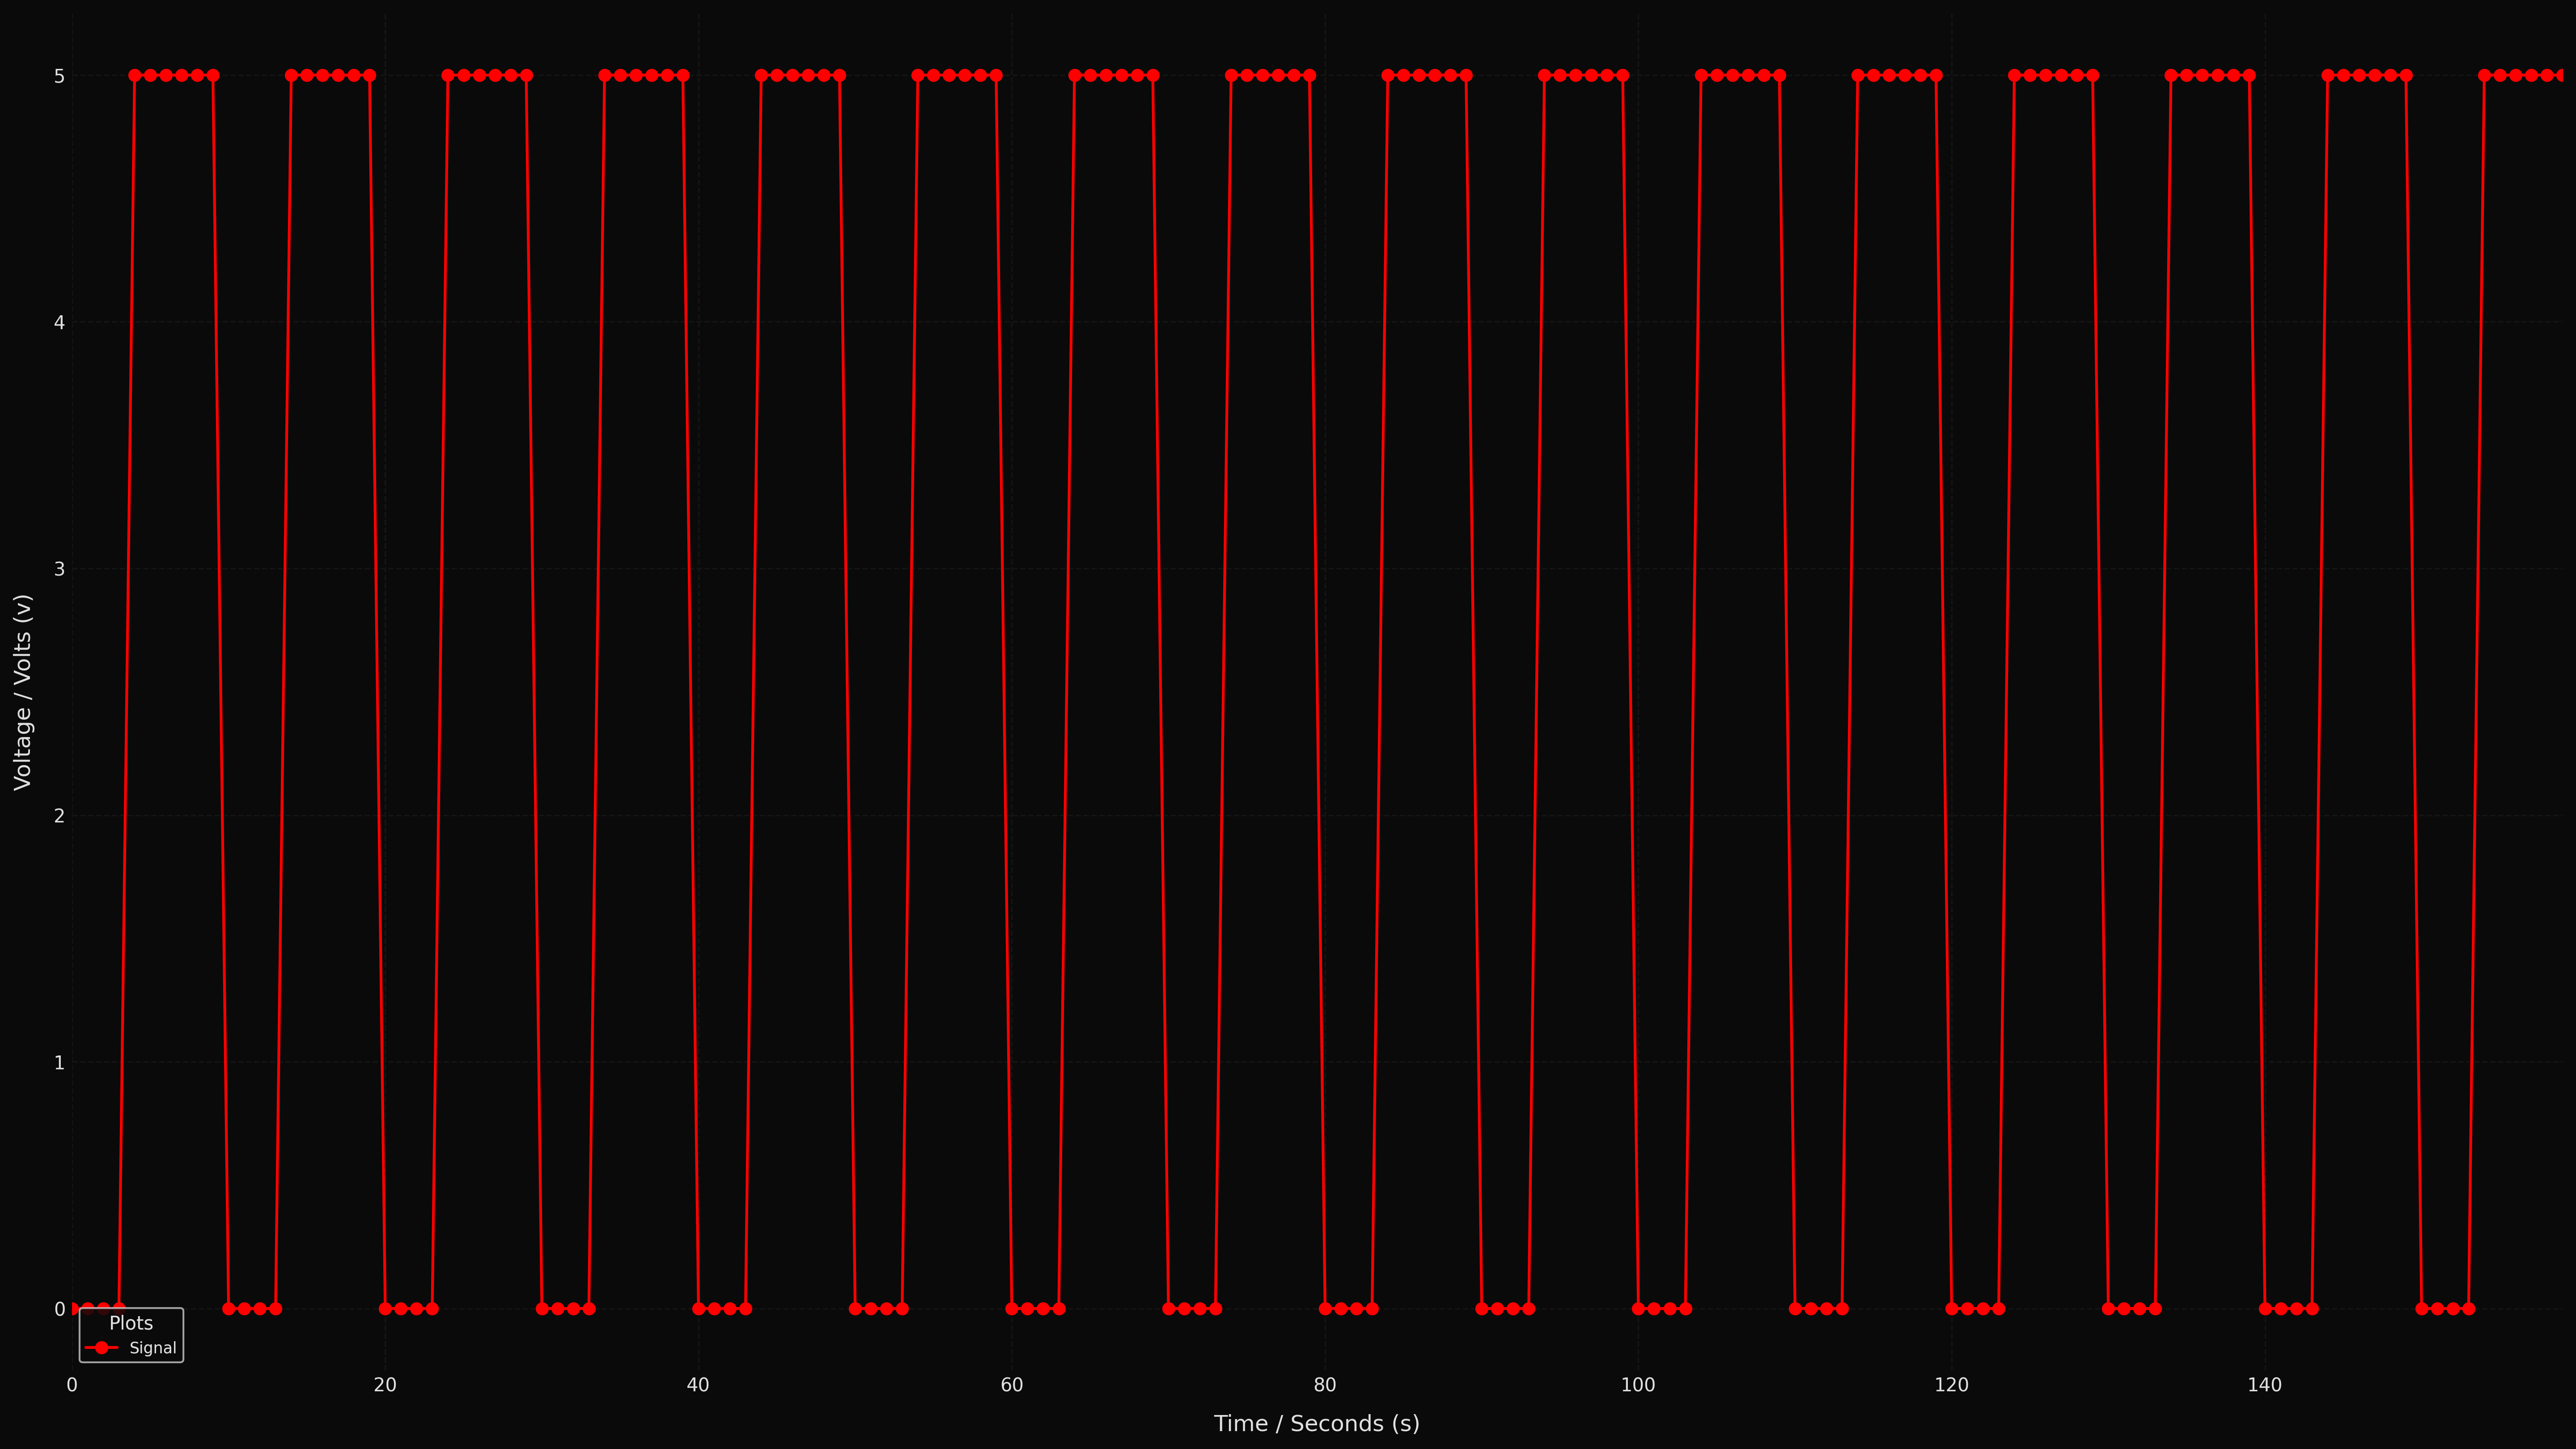
signal_voltages = np.asarray([0, 0, 0, 0, 5, 5, 5, 5, 5, 5] * (160 // 10))
# Create signal with the previous values, and seconds and volts as units.
signal = ses.VoltageSignal(signal_timestamps, signal_voltages, "s", "V")

# Plot signal to file.
signal.signal_plot("signal.png")
Which creates the following signal:

The generated signal in the code snippet.
- class Signal
Base class for signal, meant to be derived to create specialized signals on which to add mixins from this package with additional functionality.
A signal consists in two 1xN arrays, where N is the number of values, one with the values for the horizontal axis and another one with the values for the vertical axis. The number of values in each array must be the same, and additionally the values of the horizontal axis must satisfy the requirement x[n] < x[n+1] for all their values.
Note
For simplicity, the Numpy arrays provided to this class are copied internally, changes outside this classs to the arrays provided will not reflect on the internal ones, use the relevant getters and setters to reflect this changes on the internal arrays.
- __init__(hvalues, vvalues, *args, hunits=None, vunits=None, **kwargs)
The constructor for the signal class.
- Parameters:
hvalues (
ndarray[Any,dtype[float64]]) – A 1xN array with the values of the horizontal axis to copy for the signal.vvalues (
ndarray[Any,dtype[float64]]) – A 1xN array with the values of the vertical axis to copy for the signal.hunits (
Optional[Units]) – The units of the values of the horizontal axis for plots, defaults to no units.vunits (
Optional[Units]) – The units of the values of the vertical axis for plots, defaults to no units.
- property _logger: Logger
Getter for the logger for the signal, use this from the derived class to print information to the logger of the package. For information on how to configure the package logger refer to
get_logger().- Return type:
- Returns:
The logger.
- property _hunits: Units
Getter for the units of the values of the horizontal axis.
- Return type:
- Returns:
The units.
- property _vunits: Units
Getter for the units of the values of the vertical axis.
- Return type:
- Returns:
The units.
- signal_plot(path, *args, begin=None, end=None, munits=0, **kwargs)
Performs a plot of the signal.
- Parameters:
path (
str) – The path where to store the plot, seePlotter.plot().args – Additional arguments to pass to the plotting function, see
Plotter.plot().begin (
Optional[float]) – The begin value of the horizontal axis where the plot starts, seePlotter.plot().end (
Optional[float]) – The end value of the horizontal axis where the plot ends, seePlotter.plot().munits (
float) – Margin units for the plot, seePlotter.plot().kwargs – Additional keyword arguments to pass to the plotting function, see
Plotter.plot().
- Return type:
Self- Returns:
Instance of the class.
- exception SignalError
Signal exception class.
Voltage Signal
The voltage signal class, VoltageSignal, is a specialized signal for timestamps and voltages, shipped
as part of python-signal-edges and used throughout the examples in the documentation. It is also available to use from the
user code.
- class VoltageSignal
Bases:
ButterworthFiltersMixin,EllipticFiltersMixin,BesselFiltersMixin,StateLevelsMixin,EdgesMixin,SignalPredefined implementation of a
Signalthat represents an analog voltage signal as captured, for example, by an oscilloscope, data recorder or similar.The horizontal axis of the signal contains the timestamps values and the vertical axis of the signal contains the voltage values, in miliseconds or seconds and in milivolts or volts respectively.
- __init__(timestamps, voltages, timestamp_unit_id=None, voltage_unit_id=None)
Class constructor.
- Parameters:
timestamps (
ndarray[Any,dtype[float64]]) – The timestamp values for the signal.voltages (
ndarray[Any,dtype[float64]]) – The voltage values for the signal.timestamp_unit_id (
Optional[Literal['ms','s']]) – An identifier for the timestamp units, can be ignored if not plotting.voltage_unit_id (
Optional[Literal['mV','V']]) – An identifier for the voltage units, can be ignored if not plotting.
- exception VoltageSignalError
Voltage signal exception class.