State Levels
The state levels mixin, StateLevelsMixin, can be added to Signal to obtain the levels for
the logical states of a signal using different modes, Mode, based on histograms.
The resulting values for the state levels are returned as StateLevels.
Note
This implementation mimics Mathworks statelevels or Octave statelevels, these links provide more information about the inner details.
The code snippet below shows how to add this functionality to a signal:
import signal_edges.signal as ses

class ExampleSignal(ses.state_levels.StateLevelsMixin, ses.Signal):
    pass
An example of its usage using VoltageSignal is described below:
import numpy as np
import signal_edges.signal as ses

# Create timestamps for the signal.
signal_timestamps = np.linspace(start=0, stop=160, num=160, endpoint=False)
# Create voltages for the signal, and add some noise to them.
signal_voltages = np.asarray([0, 0, 0, 0, 5, 5, 5, 5, 5, 5] * (160 // 10)) + \
                  np.random.normal(0, 0.1, 160)
# Create signal.
signal = ses.VoltageSignal(signal_timestamps, signal_voltages, "s", "V")
# Obtain state levels.
(state_levels, histogram) = signal.state_levels()

# Plot state levels and histogram.
signal.state_levels_plot("signal.png", state_levels, histogram=histogram)
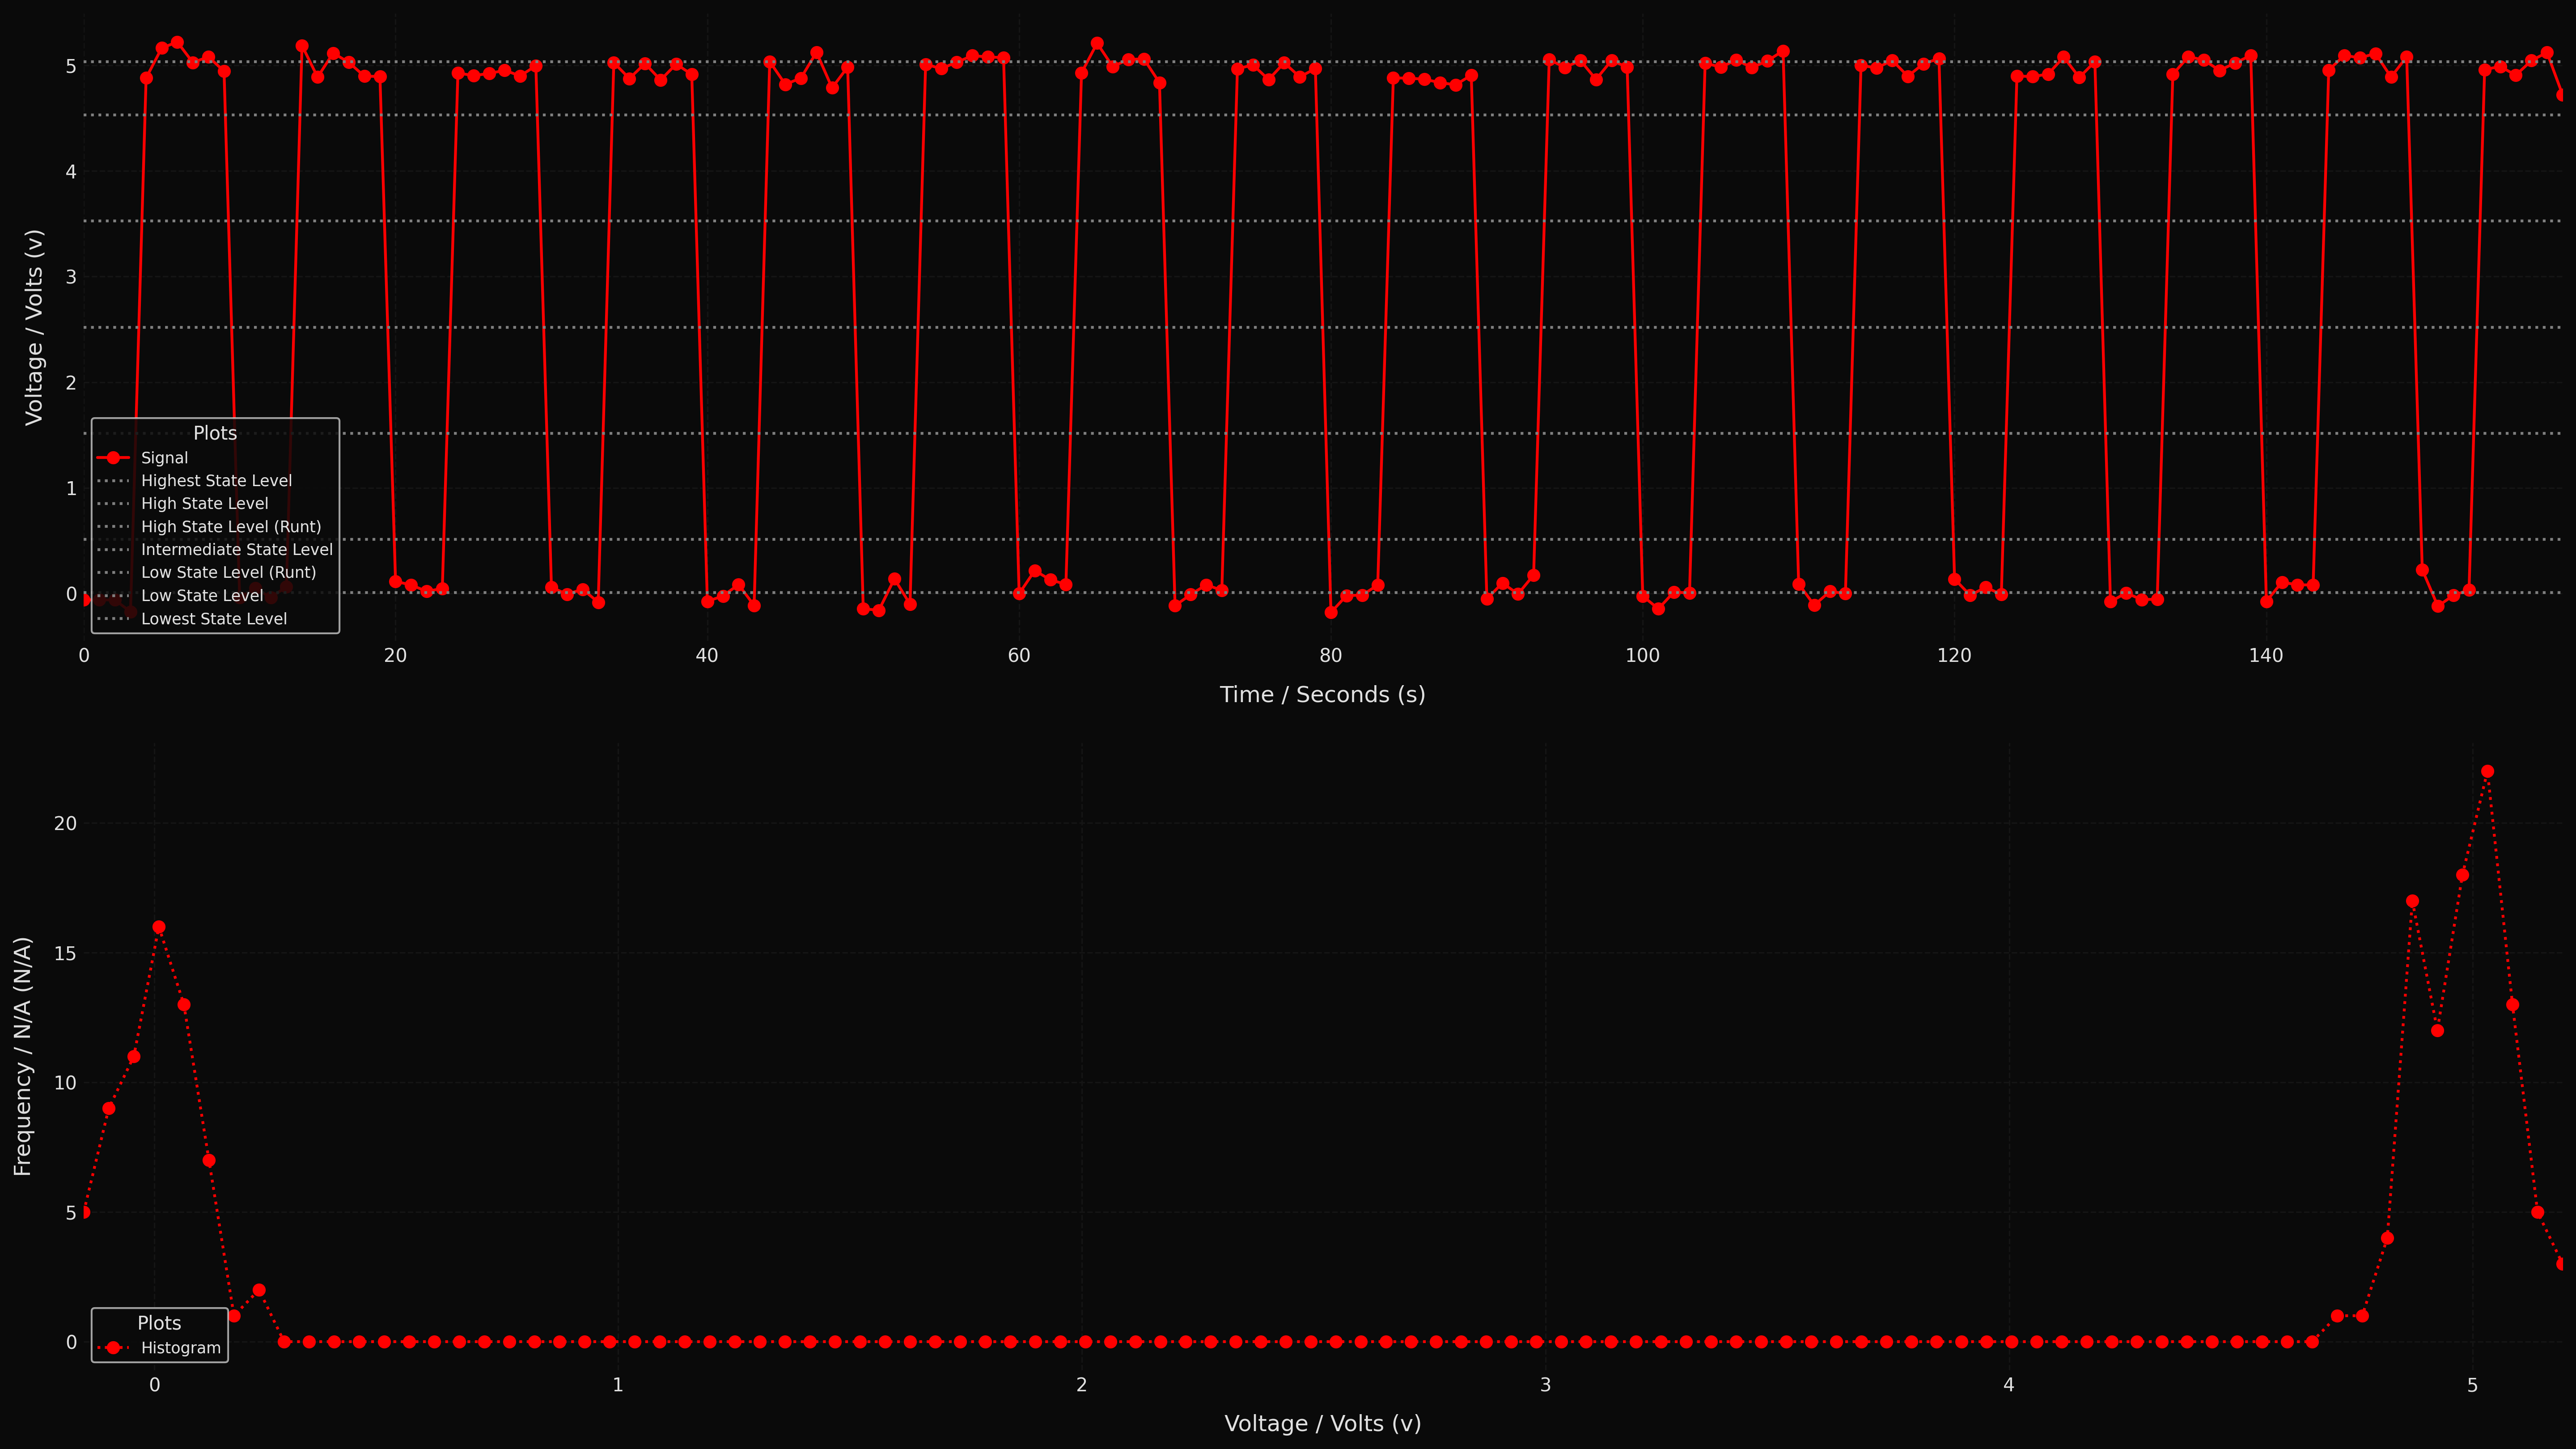
This code snippet generates the following plot:

The generated signal with the state levels calculated and the histogram.
- class StateLevelsMixin
State levels mixin
Signalthat implements calculation of state levels based on histograms.- __init__(*args, **kwargs)
Class constructor.
- state_levels(mode=Mode.HISTOGRAM_MODE, nbins=100, bounds=None, high_ref=90.0, high_runt_ref=70.0, intermediate_ref=50.0, low_runt_ref=30.0, low_ref=10.0)
Finds the state levels of a signal using histograms.
- Parameters:
mode (
Mode) – The histogram mode used to calculate the state levels.nbins (
int) – Number of bins to use in the histogram.bounds (
Optional[tuple[float,float]]) – The lower and upper bounds of the signal, defaults to minimum and maximum peak values.high_ref (
float) – A percentage reference value of the full range for thehighlevel.high_runt_ref (
float) – A percentage reference value of the full range for thelow runtlevel.intermediate_ref (
float) – A percentage reference value of the full range for theintermediatelevel.low_runt_ref (
float) – A percentage reference value of the full range for thelow runtlevel.low_ref (
float) – A percentage reference value of the full range for thelowlevel.
- Raises:
StateLevelsError – The reference values must be in the range 0 <= x <= 100.
StateLevelsError – The reference values must satisfy low_ref < low_runt_ref < intermediate_ref < high_runt_ref < high_ref.
StateLevelsError – The bounds provided must satisfy bounds[0] <= bounds[1].
StateLevelsError – The minimum number of bins is two.
- Return type:
tuple[StateLevels,tuple[ndarray[Any,dtype[float64]],ndarray[Any,dtype[float64]]]]- Returns:
The state levels and the values for the horizontal and vertical axes of the histogram.
- state_levels_to_array(levels, array_id)
Convert the specified level from the state levels provided to an array of the same length as the number of values in the signal.
- Parameters:
levels (
StateLevels) – State levels with the values to convert to arrays.array_id (
Literal['highest','high','high_runt','intermediate','low_runt','low','lowest']) – The array identifier used to identify the state level to convert.
- Raises:
StateLevelsError – The array identifier provided is not valid.
- Return type:
tuple[ndarray[Any,dtype[float64]],ndarray[Any,dtype[float64]]]- Returns:
The values of the horizontal axis and the values on the vertical axis for the level specified.
- state_levels_plot(path, state_levels, *args, begin=None, end=None, munits=0, levels=(), histogram=None, **kwargs)
Performs a plot of the signal with the specified levels and optionally the histogram.
- Parameters:
path (
str) – The path where to store the plot, seePlotter.plot().state_levels (
StateLevels) – The state levels to plot.args – Additional arguments to pass to the plotting function, see
Plotter.plot().begin (
Optional[float]) – The begin value of the horizontal axis where the plot starts, seePlotter.plot().end (
Optional[float]) – The end value of the horizontal axis where the plot ends, seePlotter.plot().munits (
float) – Margin units for the plot, seePlotter.plot().levels (
Sequence[Literal['highest','high','high_runt','intermediate','low_runt','low','lowest']]) – The levels to plot, defaults to all levels.histogram (
Optional[tuple[ndarray[Any,dtype[float64]],ndarray[Any,dtype[float64]]]]) – The horizontal and vertical axes values of the histogram, defaults to no histogram.kwargs – Additional keyword arguments to pass to the plotting function, see
Plotter.plot().
- Return type:
Self- Returns:
Instance of the class.
- class Mode
Mode that defines the algorithm to calculate the state levels.
- HISTOGRAM_MODE = 1
Histograms with mode values.
- HISTOGRAM_MEAN = 2
Histograms with mean values.
- class StateLevels
Definition of the state levels of the signal, in the same units as the units of the values of the vertical axis of the signal from which they were calculated, refer to
state_levels()for details.The values satisfy lowest < low < low_runt < intermediate < high_runt < high < highest.
The full range in this context refers to highest - lowest.
- Parameters:
highest (
float) – Highest level, equal to 100% of the full range.high (
float) – High level, maps tohigh_refpercentage value.high_runt (
float) – High runt level, maps tohigh_runt_refpercentage value.intermediate (
float) – Intermediate level, maps tointermediate_refpercentage value.low_runt (
float) – Low runt level, maps tolow_runt_refpercentage value.low (
float) – Low level, maps tolow_refpercentage value.lowest (
float) – Lowest level, equal to 0% of the full range.
- exception StateLevelsError
State levels exception class.